Channel Tracker
Real subscriber and view growth — one of the inputs we use to value each channel. Top 50 of our financial valuation platform, based on real daily snapshots, not a projection.
- All countries
- AE
- AT
- AU
- BE
- BR
- CA
- CH
- CO
- DE
- GB
- ID
- IN
- IT
- KR
- MX
- PE
- PK
- SA
- TZ
- US
| # | Channel | Country | Category | Subscribers | Δ Views | Δ Views % | Δ Subscribers | Δ Subscribers % |
|---|---|---|---|---|---|---|---|---|
| 1 |
 Justin Bieber |
CA | Music | 79,500,000 | +399M | +1.0% | 0 | 0.0% |
| 2 |
 KAROL G |
CO | Music | 41,500,000 | +223.1M | +0.6% | 0 | 0.0% |
| 3 |
 Santa Fe Klan Official |
MX | Music | 12,400,000 | +173.4M | +2.7% | 0 | 0.0% |
| 4 |
 NickyJamTV |
US | Music | 24,800,000 | +118.8M | +0.6% | 0 | 0.0% |
| 5 |
 Zack D. Films |
— | Entertainment & Comedy | 29,200,000 | +80.4M | +0.1% | 0 | 0.0% |
| 6 |
 MrBeast |
US | Entertainment & Comedy | 522,000,000 | +74.4M | +0.1% | +1M | +0.2% |
| 7 |
 KL BRO Biju Rithvik |
— | Family | 89,900,000 | +58.2M | +0.1% | 0 | 0.0% |
| 8 |
 Corazón Serrano |
PE | Not specified | 3,190,000 | +47.5M | +1.0% | 0 | 0.0% |
| 9 |
 Celine Dept |
BE | Not specified | 67,700,000 | +31.3M | +0.0% | 0 | 0.0% |
| 10 |
 김프로KIMPRO |
KR | Entertainment & Comedy | 135,000,000 | +30.4M | +0.0% | 0 | 0.0% |
| 11 |
 SET India |
IN | Not specified | 190,000,000 | +29.2M | +0.0% | 0 | 0.0% |
| 12 |
 Doja Cat |
US | Music | 14,200,000 | +28.4M | +0.2% | 0 | 0.0% |
| 13 |
 B20baOfficiel |
— | Not specified | 4,460,000 | +27.3M | +0.8% | 0 | 0.0% |
| 14 |
 Emiway Bantai |
IN | Not specified | 22,300,000 | +26.1M | +0.6% | 0 | 0.0% |
| 15 |
 Geôlier2 OFFICIAL |
IT | Music | 1,350,000 | +22M | +1.1% | 0 | 0.0% |
| 16 |
 ARY Digital HD |
PK | Not specified | 68,700,000 | +21M | +0.0% | +100K | +0.1% |
| 17 |
 ohnepixel raw |
DE | Gaming | 1,290,000 | +20.6M | +0.5% | +20K | +1.6% |
| 18 |
 MrBeast Gaming |
US | Gaming | 60,700,000 | +19.7M | +0.2% | 0 | 0.0% |
| 19 |
 Red Bull |
AT | Not specified | 30,000,000 | +19.3M | +0.1% | 0 | 0.0% |
| 20 |
 Alex Crashers |
MX | Gaming | 9,120,000 | +18.2M | +0.3% | +50K | +0.6% |
| 21 |
 HUM TV |
PK | Not specified | 55,400,000 | +18M | +0.0% | 0 | 0.0% |
| 22 |
 Nick DiGiovanni |
US | Cooking & Recipes | 47,600,000 | +17.7M | +0.1% | 0 | 0.0% |
| 23 |
 Gorillaz |
GB | Music | 13,600,000 | +17.1M | +0.2% | 0 | 0.0% |
| 24 |
 Harmonize |
TZ | Not specified | 6,050,000 | +16.7M | +1.0% | 0 | 0.0% |
| 25 |
 Topper Guild |
US | Not specified | 95,400,000 | +16.5M | +0.0% | +100K | +0.1% |
| 26 |
 Las Gemelas Del Free |
CO | Gaming | 8,310,000 | +14.9M | +0.4% | 0 | 0.0% |
| 27 |
 Thanthi TV |
IN | Not specified | 13,300,000 | +14.4M | +0.1% | 0 | 0.0% |
| 28 |
 ZAMZAM BROTHERS OFFICIAL |
AE | Entertainment & Comedy | 84,900,000 | +14.2M | +0.0% | 0 | 0.0% |
| 29 |
 Behindwoods TV |
IN | Entertainment & Comedy | 20,800,000 | +13.5M | +0.0% | 0 | 0.0% |
| 30 |
 Hindia |
ID | Music | 1,190,000 | +13.3M | +1.0% | 0 | 0.0% |
| 31 |
 Tips Official |
IN | Music | 82,600,000 | +13.2M | +0.0% | 0 | 0.0% |
| 32 |
 WWE |
— | Not specified | 114,000,000 | +13.1M | +0.0% | 0 | 0.0% |
| 33 |
 Marília Mendonça |
BR | Music | 27,700,000 | +13M | +0.1% | +100K | +0.4% |
| 34 |
 2TONoffical |
CH | Not specified | 816,000 | +11.9M | +0.6% | 0 | 0.0% |
| 35 |
 Mazhavil Manorama |
IN | Not specified | 21,100,000 | +11.8M | +0.0% | 0 | 0.0% |
| 36 |
 Hep Gezen |
BR | Entertainment & Comedy | 12,300,000 | +11.7M | +0.1% | 0 | 0.0% |
| 37 |
 MS NOW |
US | Not specified | 10,000,000 | +11.2M | +0.1% | 0 | 0.0% |
| 38 |
 Futcrunch |
GB | Gaming | 24,100,000 | +11.1M | +0.1% | 0 | 0.0% |
| 39 |
 IndiaTV |
IN | Not specified | 50,900,000 | +11.1M | +0.0% | 0 | 0.0% |
| 40 |
 Sourav Joshi Vlogs |
IN | Family | 42,200,000 | +11M | +0.0% | 0 | 0.0% |
| 41 |
 SBS 뉴스 |
KR | Not specified | 5,300,000 | +11M | +0.1% | 0 | 0.0% |
| 42 |
 Bento e Totó |
BR | Not specified | 11,000,000 | +10.9M | +0.1% | 0 | 0.0% |
| 43 |
 ATEEZ |
— | Music | 5,710,000 | +10.8M | +0.5% | 0 | 0.0% |
| 44 |
 7clouds |
US | Not specified | 33,800,000 | +10.5M | +0.0% | 0 | 0.0% |
| 45 |
 Rotana |
SA | Music | 27,600,000 | +10.5M | +0.0% | 0 | 0.0% |
| 46 |
 Saturday Night Live |
US | Not specified | 17,400,000 | +10.4M | +0.1% | 0 | 0.0% |
| 47 |
 Tones And I |
AU | Music | 5,500,000 | +10.4M | +0.3% | 0 | 0.0% |
| 48 |
 anna dreamy ASMR |
BR | Health, Fitness & Wellness | 8,130,000 | +10.1M | +0.2% | +10K | +0.1% |
| 49 |
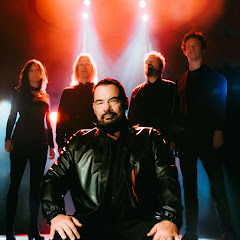 Alphaville (official) |
— | Not specified | 716,000 | +10.1M | +1.0% | 0 | 0.0% |
| 50 |
 Republic Bharat |
IN | Not specified | 32,000,000 | +9.9M | +0.0% | 0 | 0.0% |
This is just a sample
Our paid plans include complete financial valuation of all your monitored channels, growth history, and automatic daily updates.
See the plans